Research Hightlights
Mira variable atmospheres are wonderful laboratories for studying both molecule and dust formation processes within circumstellar environments (CSEs). Below are highlights of what I've been working on as I play in these amazing laboratories.
Spitzer IRS Spectra

My doctoral work included analysis of mid-IR spectra of Mira variables taken with phase, using the high resolution module of Spitzer's IRS (R ~ 600). This is a unique, rich data set due to multiple observations of each star and the high SNR from quick exposure times to prevent saturation of the detector. We have spectra of all chemical sub-classes, M-types, S-types, and C-types, and each spectrum shows a plethora of dust and molecule spectral features.
Each spectrum in this dataset is unique and show an astonishing amount of features.
The M-types (oxygen-rich) show strong carbon dioxide features and lots of silicate dust features. The C-types (carbon-rich) show acetylene and hydrogen-cyanide features. Some of S-types (intermediate chemistry) also show these carbon species, where others do not (as expected with S-types!!)
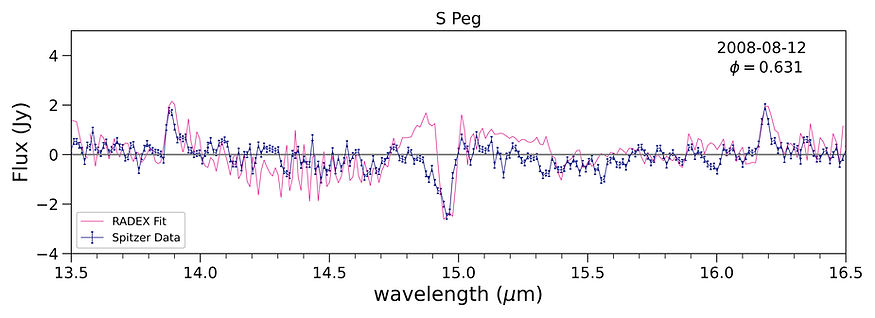
What is astonishing is seeing how variable the spectra are across the phase of the star---see S Peg on the home page for one of my favorite examples :)


Each spectrum showed a previously un-observed feature at 17.62 microns. This is an extremely sharp feature that shows variability across the pulsation phase.
Identifying this feature has not been trivial. Much of the necessary data, such as oscillator strengths, are missing at mid-IR wavelengths. Based on what data is available and considering what metal can be present across all 3 chemical sub-classes we have identified this feature as possible Fe I fluorescence.

CO2 models with RADEX
To model CO2 in M-type Mira atmospheres I adapted the non-LTE radiative transfer code RADEX for use in the mid-IR. This molecular file currently includes the 8 CO2 vibrational transitions in the mid-IR (shown at left). Each vibrational state contains up to J=50 rotational levels. The file includes 818 radiative transitions, and 20,000 collisional rate coefficients. All Einstein A coefficients, transition wavelengths, and energy levels were taken from HITRAN I extrapolated collisional rate coefficients, which involves calculating the conditional probability that a full state-to-state transition will occur. A sample slab spectrum of CO2 is shown below.

CO2 slab spectrum calculated with RADEX
I used RADEX to successfully model 44 spectra of the M-types in our Spitzer set.
Models for S Peg, which has some of my favorite spectra in the whole set, show a dynamic change of the 15 micron feature as it moves from deep absorption to a near non-detection. This behavior is likely caused by shocks from the pulsation.

Characterizing CO2 in Mira Atmospheres
I combined the RADEX spectral models with interferometric measurements we had of our Spitzer stars to directly calculate an emitting region of the CO2 gas.
Combing spectral models with interferometric measurements provides us with a full characterization of the CO2 gas.
CO2 gas results for stars that show the 15 micron band in absorption.

Here we see that the CO2 kinetic temperature deviates far from equilibrium calculations would predict. A 600 K gas near 2 R is quite surprising. This deviation from radiative equilibrium has been theorized in Willson 2000 as a "refrigeration zone" and can have significant impact for dust formation.

CO2 gas results for stars that show the 15 micron band in emission.
When the 15 micron feature was seen in emission the CO2 layers were much cooler and traced more extended regions of the atmosphere.